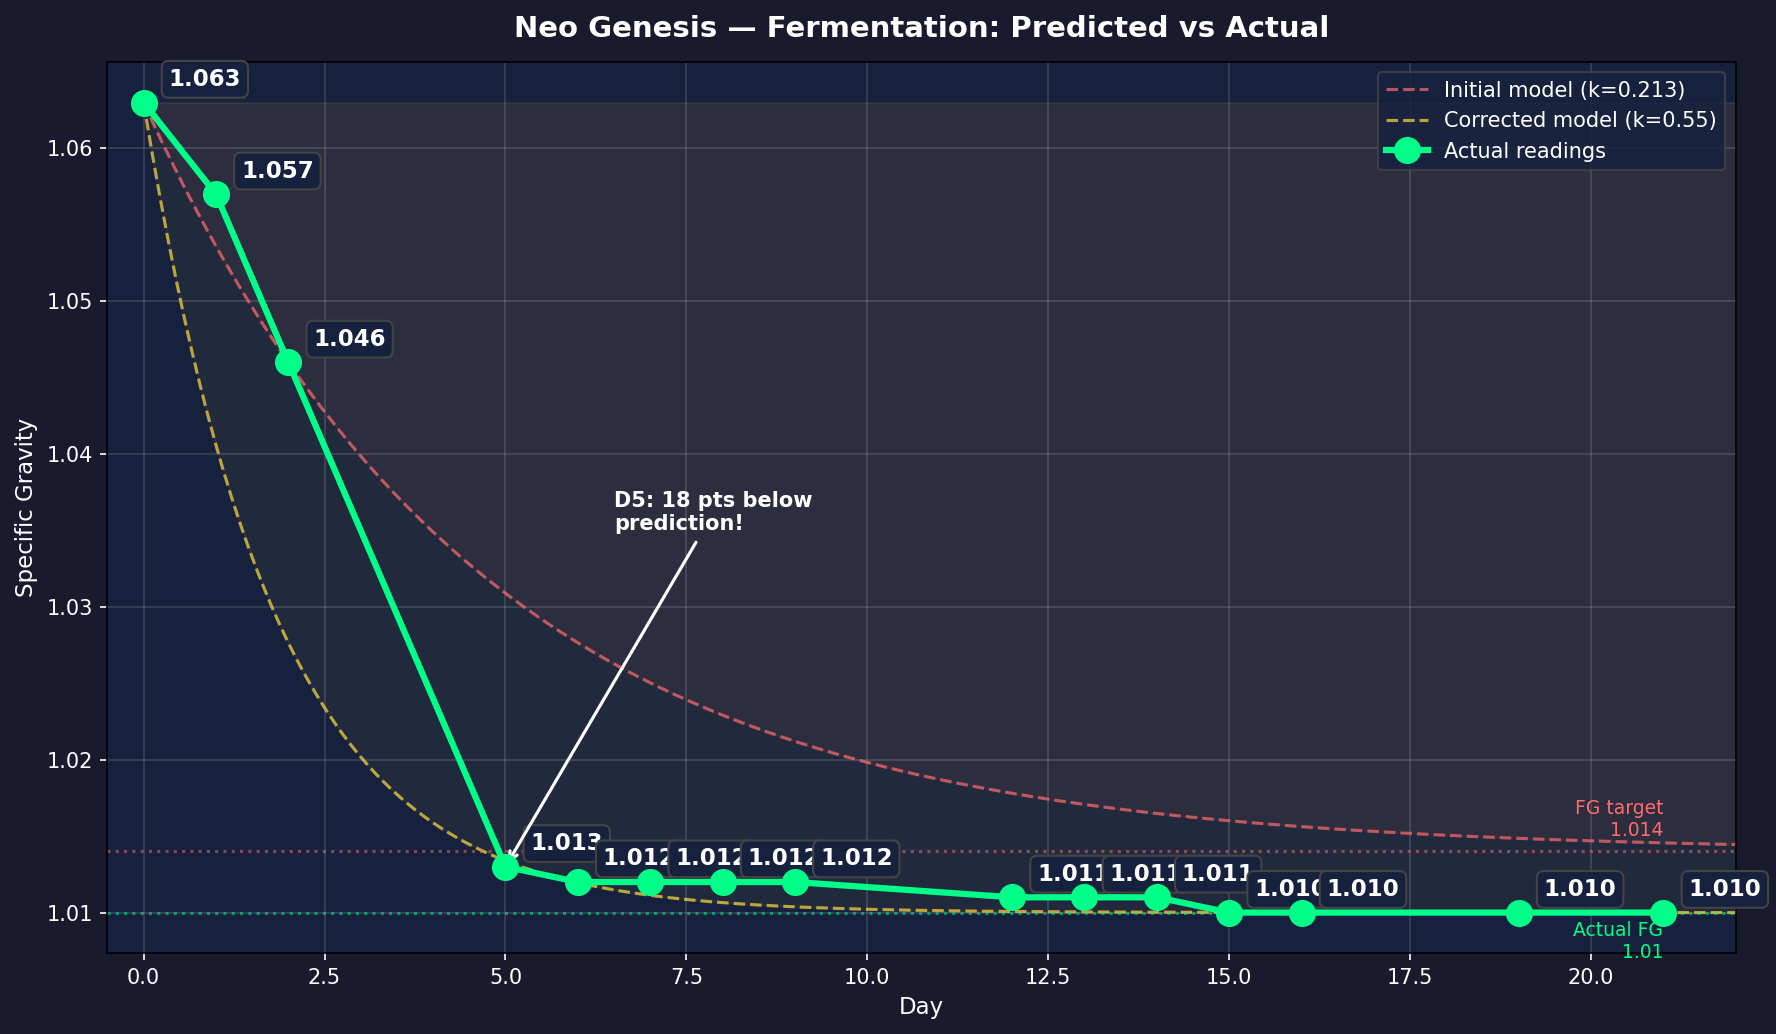
The yeast rewrote the model.
The first fermentation model used the textbook constant k=0.213 and missed by 18 gravity points. WHC LAX ferments ~2.6× faster; refit to k=0.55 and the curve matched. Don't predict from fewer than three data points.
26 days · every reading logged
ทุกตัวเลขพิสูจน์ได้. The AI had no nose and no tongue — but it kept the numbers. A 530-litre batch, modelled, plotted, and checked against a human standing by the tank. Every claim here traces back to a real measurement.
The first fermentation model used the textbook constant k=0.213 and missed by 18 gravity points. WHC LAX ferments ~2.6× faster; refit to k=0.55 and the curve matched. Don't predict from fewer than three data points.
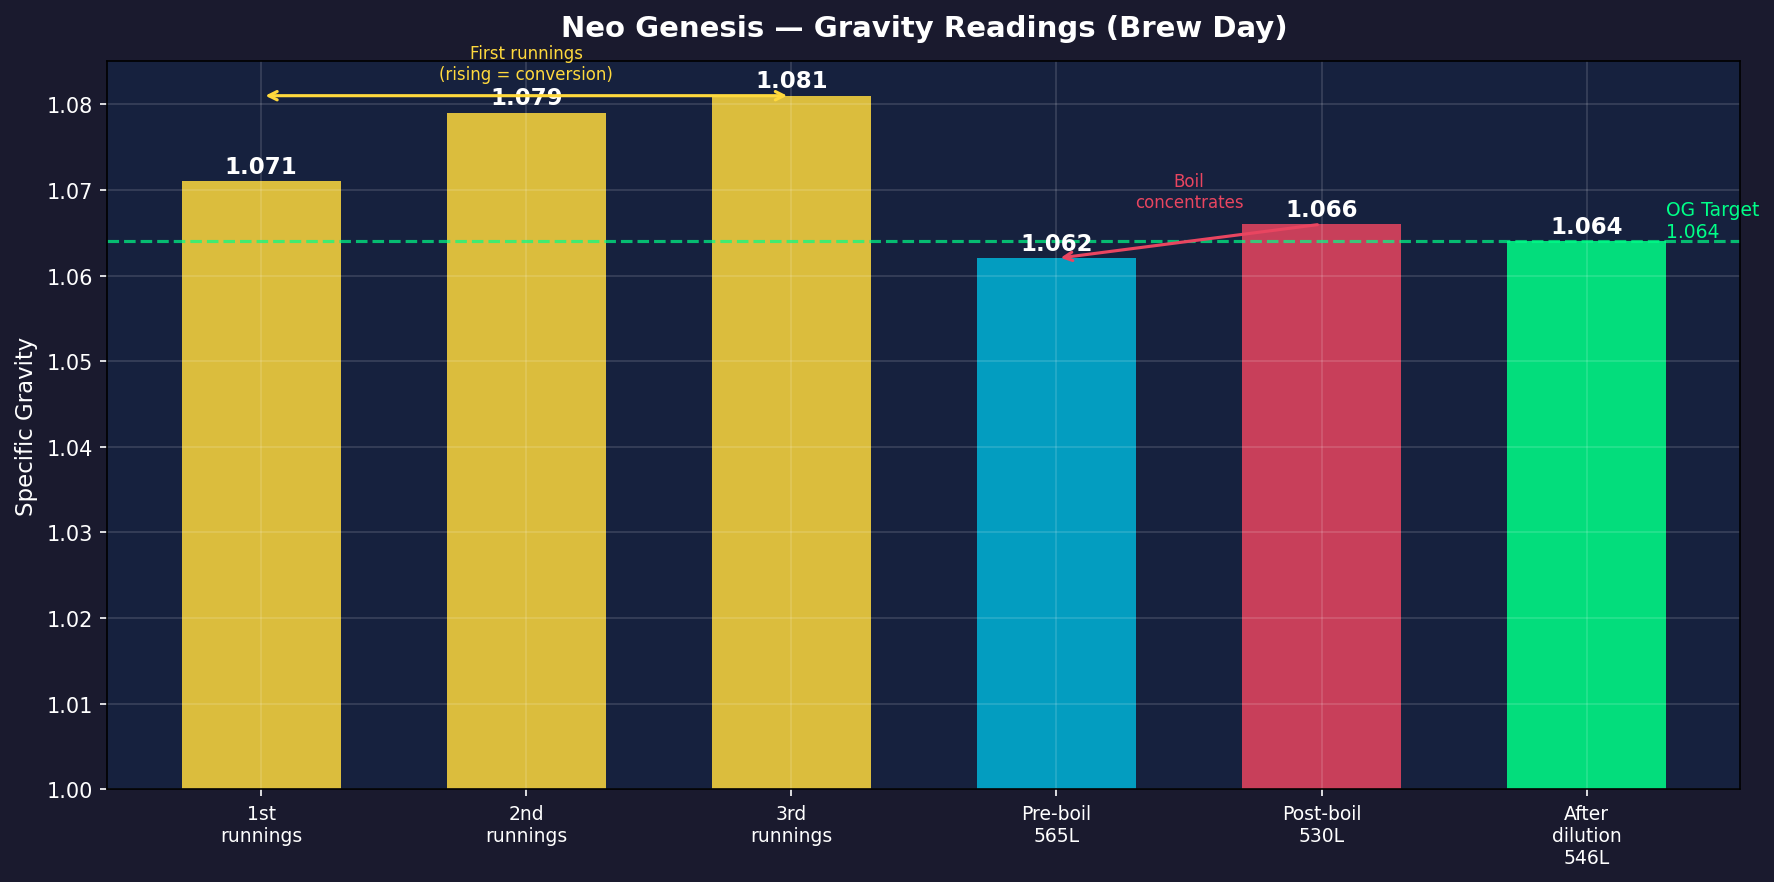
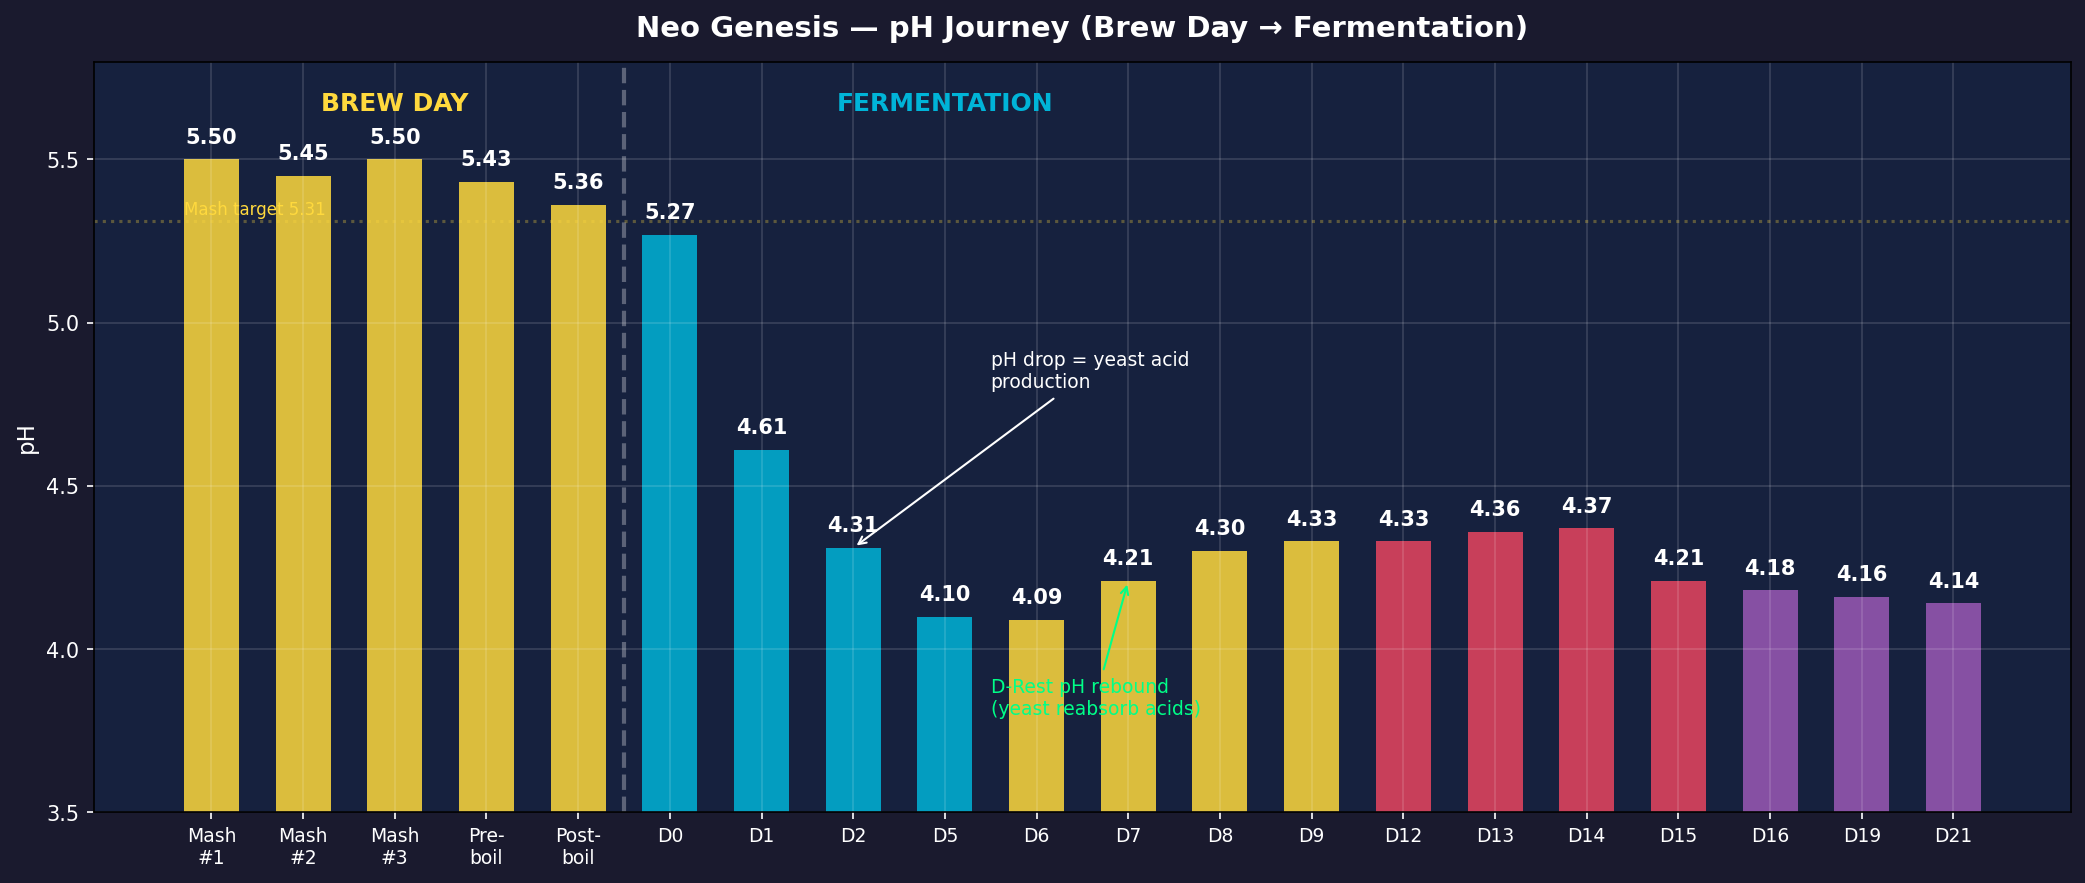
The AI built a calc bench (Brix↔SG, dilution, efficiency, FG-correction, Newton cooling), eleven plotting/analysis scripts, and an MQTT publisher feeding the tap-side display — 19 instruments for one batch. No invented numbers.
Raw data lives in the brew-day CSV and batches.json; the plots above are rendered straight from it. Numbers over branding.